CS 543 Spring 2019
MP 0: Demosaicing
Due date: January 25, 11:59:59 PM
The goal of the assignment is to get started with image processing in Python by implementing a very simple demosaicing algorithm. Please download the starter code and data here. You are provided some images and an ipython notebook for getting started.
The "mosaic" image was created by taking the original color image and keeping only one color component
for each pixel, according to the standard Bayer pattern:

Source
So, once you read the "mosaic" image into a matrix, entry (1,1) will be the value of the "red" component
for pixel (1,1), entry (1,2) will be "green", etc.
Part 1: Linear Interpolation
Implement a very simple linear interpolation approach to demosaicing: for each pixel, fill in the two missing channels by averaging either the four or the two neighboring known channel values: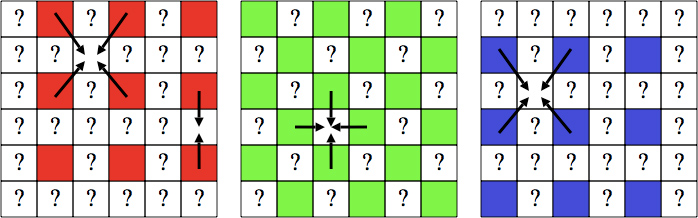
Avoid using loops! Instead, use the scipy.ndimage.correlate or scipy.ndimage.convolve function . (You can use any other function which has similar functionality from any other module).
The above method, being very simple, does not work perfectly. You can see where it makes mistakes by
computing a map of squared differences (summed over the three color components) between the original
and reconstructed color value for each pixel. Compute such a map and display it using the skimage.io.imshow or cv2.imshow or matplotlib.pyplot.imshow . In addition, compute the average and maximum per-pixel errors for the image.
Finally, show a close-up of some patch of the reconstructed image where
the artifacts are particularly apparent and explain the cause of these artifacts.
You need to implement the get_solution_image function and the compute_errors function for this part in the ipython notebook provided to you.
Part 2: The Freeman Method
In 1985, Bill Freeman proposed an improvement of the simple bilinear interpolation approach. Since the G channel is sampled at a higher rate than the R and B channels, one might expect interpolation to work better for G values. Then it would make sense to use the interpolated G channel to modify the interpolated R and B channels. The improved algorithm begins with linear interpolation applied separately to each channel, just as you have already done above. The estimated G channel is not changed, but R and B channels are modified as follows. First, compute the difference images R-G and B-G between the respective interpolated channels. Mosaicing artifacts tend to show up as small "splotches" in these images. To eliminate the "splotches", apply median filtering (scipy.signal.medfilt2d command in Python) to the R-G and B-G images. Finally, create the modified R and B channels by adding the G channel to the respective difference images.
Implement the above algorithm and visualize the quality of the results in the same way as for
Part 1 by displaying the error image and computing average and maximum error. Compare the output
to that of Part 1. Are there visible improvements (especially in the close-up patch selected
in Part 1)?
You need to implement the get_freeman_solution_image function function for this part in the ipython notebook provided to you.
Hint: Implementing this method should take you about two lines of code.
Part 3: Processing two images of your choice
Choose two additional color images, create a fake "mosaic" by removing the two color
channels according to the Bayer pattern and apply the demosaicing algorithm to them.
Try to find images for which demosaicing "breaks" particularly badly.
You need to implement the get_mosaic_image function function for this part in the ipython notebook provided to you.
For Bonus Points
Here are some optional ideas for digging a little deeper:- Propose (or look up online) additional improvements to make demosaicing work better. Implement some improvements and compare the results.
IPython
The assignment is given to you in the MP0.ipynb file. If you are using a local machine, ensure
that ipython is installed (https://ipython.org/install.html). You may
then navigate the assignment directory in terminal and start a local ipython server using the jupyter notebook
command.
Submission Instructions
You must upload three files to Compass 2g.- Your code in a single Python file. The filename should be netid_mp0_code.py or netid_mp0_code.ipynb.
- Your ipython notebook with output cells converted to PDF format. The filename should be netid_mp0_output.pdf.
- A brief report in PDF format. The filename should be netid_mp0_report.pdf. Use this template to create your report.
Please refer to course policies on collaborations, late submission, and extension requests.
Useful Python Links